Radar Chart
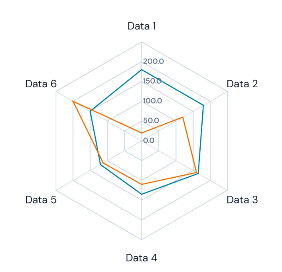
Radar Chart is a chart that is used to display multivariate data in the form of a two-dimensional chart of three or more quantitative variables represented on axes starting from the same point.
| Type | Resource |
|---|---|
| Design | Figma |
| Mobile | Mobile Storybook |
| Code | Gitlab |
Usage
To implement Line Chart, you can use this tag radarchart in the Kotlin file.
import id.co.biofarma.binduiandroid.components.radarchartval radarLabels =
listOf(
"Data 1",
"Data 2",
"Data 3",
"Data 4",
"Data 5",
"Data 6",
)
RadarChart(
    id = "radar-chart-bio",
    labels = radarLabels,
    size = "md",
    scalarSteps = 10,
    data = data
)
Examples
Size
Set the size prop to sm, md, or lg for different type of line chart.

Props
| Props | Required | Default | Type | Description |
|---|---|---|---|---|
| id | True | - | String | Unique identifier for the chart |
| size | True | md | String | Size of the chart |
| scalarSteps | True | - | Int | Number of steps in the scalar |
| scalarValue | True | - | `Double | Value of the scalar |
| data | True | List<> | List<Double> | Data for the chart |
| labels | False | List<> | List<String> | Labels for the chart |